Wednesday, May 9, 2012

Climate, Disasters and Vulnerability

Overview:


The Port Orford region has the potential to be affected negatively by climate change. Some of the dangers include:
   An increase in annual air temperatures
   Extreme precipitation 
   Coastal erosion and inundation


Single disaster events influenced by these climate change characteristics include but are not limited to:
   Winterstorm
   Flooding
   Landslide
   Wildfire


The general indications of climate change for the area suggests flooding, sea rise and increased air and sea temperatures causing more cyclonic activity in the region. Extreme events are more likely given the increase of Greenhouse gas emissions.


Impacts to the area are going to be relatively small as the community itself is extremely small. The area does not produce any significant product that would alter any particular changes in another area either.


Background: 


These events can serve as a considerable problem for Port Orford. According to the IPCC Synthesis Report (2007) sea level rise has been happening since 1961 and 11 of the past 12 years have been the warmest yet. "There is high confidence that some hydrological systems (in North America) have also been affected through increased runoff and earlier spring peak discharge in many glacier- and snow-fed rivers and through effects on thermal structure and water quality of warming rivers and lakes." This change can promote a disturbance of the local species and habitats by dynamically changing the environment in which they live. Below are the indicated changes as reported from the IPCC Synthesis Reprot.


Though this is a broad scope of the issue, the trends are still relevant. Below is a more local perspective of CO2 influences into the environment. This is data from the Oregon Climate Change Adaptation Framework. A more local scale is important to consider when talking about climate change as deposition can vary form region to region.


This syntesis report states unequivocally that the main cause to global warming is human induced. The report shows the following diagram to support this claim. 


As a result of this carbon emission and inundation into the atmosphere, there are inevitably going to be some consequences. The IPCC shows the increase in average temperature for North America. The relationship to an increase in CO2 and increased average temperatures shows some anthropogenic relationship. The next diagram shows the global relationship.

Global warming and sea level rise or the obvious and most popular consequences from CO2 and greenhouse gas emissions. Other more relevant consequences do exist as well. The IPCC Synthesis reprot claims there is a "very likely increase in frequency of hot extremes, heat waves and heavy precipitation (and a) poleward shift of extra-tropical storm tracks with consequent changes in wind, precipitation and temperature patterns." Such consequences are relevant to Port Orford Oregon as most weather patterns already exist and are somewhat familiar. With climate change, the preceding variables would have severe consequences for the local area. Ocean acidification would also serve as a severe threat to the Port Orford Cedar Forests as the uptake of precipitation from the ocean would subsequently be released over the coastal forests before going up and over the Cascade mountain range. The result of sea rise for Port Orford is particularly hazardous as IPCC indicates there will be a 30% loss of coastal beaches across the globe in the next 100 years. 


Economically speaking, Port Orford is a struggling community, a small town in southern Oregon once based on Logging now has no expectations for growth and the main source of income is from tourists. As a small community though, they have the capacity to watch out for each other and provide assistance to those who need it most when disasters to occur. The following diagram shows the potential threats to Oregon's Coastal areas. 


With an increase of variability in weather patterns, certain possibilites to new and disasters need to be accounted for. In Port Orford, the town is doing just that and strengthened providing some consideable mitigation efforts.


Above is the CCCAP's action plan. An excerpt from the city addendum explains

"The city of Port Orford developed this addendum to the Curry County multi-jurisdictional Natural Hazards Mitigation Plan in an effort to increase the community’s resilience to natural hazards. The addendum focuses on the natural hazards that could affect Port Orford, Oregon, which include: coastal erosion, drought, earthquake, flood, landslide, tsunami, volcano, wildfire, and severe winter storm. It is impossible to predict exactly when disasters may occur, or the extent to which they will affect the city. However, with careful planning and collaboration among public agencies, private sector organizations, and citizens within the community, it is possible to minimize the losses that can result from natural hazards."

The City has taken special precautions and included a majority of the towns public services in order to create a comprehensive vulnerability assessment plan. Flood plains have been assessed and are now officially part of the City's planning coordination, wildfire coordination plans are now intact, Port Orford's transportation plan is now in place and creating an outreach team for educational facilites to provide information in the event of a disaster and the Community  Economic Development Plan is geared towards a disaster conscious framework for development. In the event of a Tsunami, the City has outlined the area of the City that is most prone to disaster.


The mitigation efforts taken on by the City of Port Orford are valuable to the community and should be held in high regard as an exemplary city taking into account the value of its citizens and formally accounting for the processes necessary to carry out a plan of this nature, especially for a town of 1200 people.


Discussion

Though Port Orford is a coastal community more prone to some significant weather pattern changes and anomalies, this wouldn't be a bad place to be in the furutre given there was several access points to get in and out of.


Wednesday, May 2, 2012

Blog #3 - Noticing the Meso and Micro effects


Climate Controls:

The map to the right shows the elevation of the Port Orford Region. The state lines are faint but noticeable. Port Orford is located at the first southern extruding tip along the coast below Washington State.  Given the mountainous regions that exist below and and to the right of Port Orford, it is easy to suggest that some weather fronts exist here given the pattern of orographic lift- almost in the shape of a backwards L. Also noticeable is the ocean and Port Orford's proximity to it. Both a large body of water and mountainous regions provide a large potential for a variety of weather patterns and events to occur. One pattern that can exist is the ponding of fronts below the Cascade Region before they are pushed up and over the mountains. As mentioned before, the Chinook winds can travel above the Siskiyou Range and flow right into Port Orford subjecting the region to other patterns and events making Port Orford somewhat exclusive.

Below is a topographic map of Port Orford, a larger scale than above to indicate particular patterns and topology that exist at the micro scale. Notice the bathymetry right off the coast. Inside the port is significantly deeper than immediately to the west of Port Orford. Winds from the SE into Port Orford can bring some cooler temps while from the W will not be as cold given the depth of the Pacific. Something to note as well, the weather station used primarily for all the data in this section and previous sections is actually located to the W of town. The portion of water that is trapped between the coast and Port Orford may cause some micro climate variations in the part of town where the weather station is. The temperature and precipitation patterns (as indicated in the graph below) show a relatively stagnant pattern where coniferous forests thrive all year long.


The Graphical Data

The following graph shows some significant historical data from Port Orford. There is an obvious relationship between precipitation and temperature for this area. 


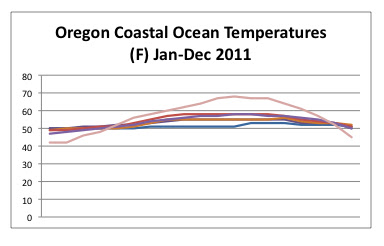
There is another relationship to be considered throughout the span of the year. Notice the regional coastal weather pattern temperatures parallel that of Port Orford temperatures. These temperatures were taken from the southern most point of the coast of Oregon to the Northern most point. Also notice the pink line that gets colder than all points also gets warmer than all the other points. What is interesting about this it is data received right off the coast of Port Orford. This suggests that the warming in the area (that is more or less unique in the region) is indicative of ocean temperatures. Quite interesting!

Click here to see an up to date description of wind speed and temperature for Southern Oregon and Northern California.


Climate Classification:


Comparing the Koppen Geiger classification of the Port Orford Region, the area along the coast of Oregon seems to be the same indicating some general weather patterns. 


An interesting pattern of vegetation that exists at a micro scale of the region is the Port Orford Cedar. Aptly named for the proximity to Port Orford. The climate appears to parallel some of the topography and vegetation explained in the map below.


According to the Klamath-Siskiyou Wildlands Center: "The Klamath-Siskiyou region has acted as refugia during past climate events, which has contributed to the region’s exceptional geologic and biological diversity.The region is an ancient climate refuge where many species once widespread across the continent were forced to retreat during past climate shift events and now persist as ‘relic species,’ found here and nowhere else on earth. Species in this category include the endemic Siskiyou Mountains Salamander, Port-Orford Cedar and the Weeping Spruce." 

Tuesday, April 17, 2012


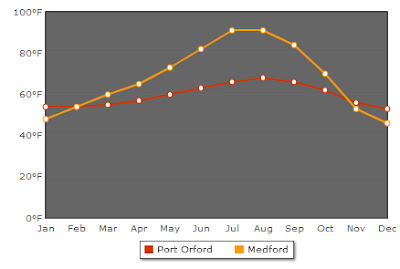
The similarites between Medford, Oregon and Port Orford, Oregon are strinking. The relative temperature and precipitaion patterns parallel each other as one might assume being in the same regional area. Though the trends are roughly the same, there are some differences. Below are three charts of Port Orford and Medford showing the monthly Average Highs and Lows and monthly precipitation.

Average High

 Average Low

 Average Precipitation
(Charts Courtesy www.weather.com)


The Air Mass of the two locales is roughly the same. Pacific Maritime Polar winds attribute most of the weather of the area. The cold fronts that hit Port Orford also hit Medford in most cases. Below are two graphs comparing the avergae monthly wind speeds of each city to the national average.

Medford
Port Orford

Both Cities have a relatively low average wind speed. For Port Orford this is surprising given the location on the coast. For Medford, this is also a surprise as it sits right in the Rogue River Valley. 
(Charts Courtesy of www.citydata.com)


It is important to note the regional elevation patters when considering precipitation of these two locations. While Port Orford receives almost 5 times as much rain as Medford, they are both on the lee side of a mountain depending on the direction of the wind patterns. The "banana belt" of Port Orford that presumably causes unseasonably warm temperatures is from the Chinook winds that flow in from the south over the Siskiyou Mountain range in Northern Claifornia. While not the primary source of weather patterns, is significant to the area. The same weather pattern may also have an affect on Medford as well causing some very mild temperatures. Lows in Medford rarely reach below the 20's and highs rarely reach above 85 F. This parallel temperature pattern is unique considering how much further inland Medford is, especially considering it is extremely close to the lee side of the Cascade Mountain range.

(Map Courtesy of Me)


The geologic structure and the impacts of volcanic activity are also something to consider with these two locations. In the map below, there is an obvious string of volcanoes that stretch the western side of the continental US. You can go to the following for a very detailed account of the geologic/volcanic structure of Oregon in  the Oregon Geology PDF. This parallels nicely with what we were talking about in class today.


Though I could not find any specific information marking a relationship between the two locations, I have a hunch that there is some critical similarity between Port Orford and Medford concerning volcanoes. Medford is 77 miles away from Crater Lake National Park. Such a short distance from one of the areas largest volcanic eruptions had to have played some role that is significant to both locations. Even if it is just a sediment role from influencing the productive agricultural activity to sediment transport down the Rogue River (which hits the ocean just below Port Orford).

Too be continued...


And just a  great LiDar image of Port Orford.

Port Orford

Thursday, April 5, 2012

Blog Post #2

Air masses of Port Orford

Port Orford experiences mP fronts that have formed over high latitude oceanic regions. While in the winter, this area experiences cP air masses that while cool and moist are also unstable. The result is the formation of warm occlusions providing the orographic lift from the mountain range to the east providing the precipitation that is so typical of the area.


Impacts of the Jet Stream on Air Masses

A jet stream is an area of strong winds ranging from 40-140 MPH. These can be thousands of miles long extending across continents effectively impacting weather patterns. These jet streams are considerable means of transport for the weather patterns experienced in any location. 


Precipitation and Air Masses

As a rule, air masses are not associated with precipitation. However, with the orographic lifting of the area, the relationship is apparent. The image below shows the annual precipitation of the area. The county at large receives moderate to above normal precipitation. What is interesting to note are the areas closest to the coast that receive the least amount of rain. With an increase in elevation, there is an increase in precipitation.


Occluded Fronts of Port Orford

This location experiences cold occluded fronts on a regular basis. Below is an example of a cold front in with a cold type occlusion reaching the western coast of the US in December 2002. This is an example of strong storm development that can occur in these conditions.


The 3 satellite images below show today's imaging from the National Weather Service

This water vapor image shows short wave troughs and jet streams as well as upward vertical motion.
Satelite Image

Visible light 
Satelite Image

Infrared
Satelite Image


How Fronts are affecting the biology of the region

Link to PDF about fronts and plankton around Port Orford OR

Abstract:
Foam lines oriented parallel to shore are common features of rocky shores. At times, the water coloration is different on either side of the foam lines, suggesting they are associated with fronts. We investigated the effect of shore-parallel foam lines and associated fronts on distributions of holo- and meroplankton. We performed CTD transects to describe the fronts and carried out vertical zooplankton tows to describe the distribution of zooplankton relative to the fronts. Fronts were within tens of meters of shore and were apparently generated by the interaction of coastal currents with local topography. We sampled four sites (three coves and one open coastal site), some of which were separated by only a few hundred meters. At each site we found shore-parallel foam lines and associated thermal fronts, but the characteristics of the fronts were different at three sites, suggesting that three different mechanisms were generating the fronts. At two coves, the foam line and front appeared to be due to the interaction of wind-driven currents from the north with coastal topography. At the third cove, the front appeared to be due to the expansion of solar-heated surface waters out of the cove. The foam line and front at the open coastal site appeared to be due to boundary mixing. At the coves, the distributions of holoplankters, meroplankters and phytoplankton were clearly altered by the presence of the fronts. At the open coastal site, the front had less effect on the distribution of zooplankton. The coastal ocean is the source of new recruits to the intertidal zone and an important source of food in the form of phytoplankton for filter feeders. We hypothesize that these very nearshore fronts may play an important role in structuring intertidal communities with which they are associated.


Misc Links

This link shows a current animation of the Western US satellite image-visible

This link shows a current animation of the Western US satellite image-infrared

Shows US map of wind direction and wind speed


Wednesday, March 7, 2012

Port Orford is a small community near the southern tip of Oregon. A small community with less than 2,000 residents, their claim to fame is living in the banana belt of Oregon where temperatures are quite mild compared to the rest of the state. Some residents claim that temperatures in the 60's and 70's in January and July are common. See Port Orford's Current Conditions and gauge the weather for yourself. The Topography of the area creates a diverse terrain with the steep slopes and heavily wooded terrain where the warm winds of California mix with the cooler, moist air of the pacific northwest. In the winter when rain and clouds are likely for most of the Oregon coast, the southern coast of Oregon experiences consistent mild, sunny days. Something known as the "Brookings Effect"has been known for the divergence of wind ultimately creating a 'gap' in weather systems being generated in the Pacific Ocean. Notice in the jet stream prediction model here how Port Orford at just south of 43 degrees North Latitude is far enough south to miss the main current. The micro climate variability is what seems to provide the area with unusually nice weather. As Port Orford is on the coast, the weather is obviously going to be more maritime but will have some effects of continentality because of warmer California winds. Given these factors, the area should have an approximate Bowen ratio of 0.6.

Sources: http://www.loudplanet.com/ and http://www.wisegeek.com/what-is-the-brookings-effect.htm

 
Mean Monthly Temperatures


JanFebMarAprMayJunJulAugSepOctNovDecAnnual
Mean max55.45656.658.661.965.16868.668.364.657.654.861.3
Mean min40.941.441.643.14649.351.452.150.847.343.440.745.7
Mean temp48.248.749.150.95457.259.760.459.65650.547.853.5
Extreme max737773808185838810291767285
Extreme min23212930313540414031291616


Annual Extremes


JanFebMarAprMayJunJulAugSepOctNovDecAnnual
Max 90 or more0000000000000
Min 32 or less2.81.80.80.3000000.10.72.27.4
Max 32 or less000000000000.10.1
Min 0 or less0000000000000


Check the daily Port Orford Satellite images here.
Check Wundermaps daily weather facts and weather here.

GEEBIT:
A.  A decrease in albedo by .1 for an albedo of -0.1 changes the absorbed energy on the surface of the planet to an average of 375.97 and a maximum of 1503.89. This creates an increase in energy absorbed to the surface of the planet. This also creates an increase in temperature to 43.9 degrees F from 41.9 degrees. An increase in Albedo to 0.1 reduces the energy absorbed to an average of 307.61 and a maximum of 1230.46. This also decreases the temperature of the planet to 28.8 degrees F.

B.  Changing the greenhouse factor to 1.1 increases the energy reached to an average of 526.5 and a maximum of 2106.2. This increase elevates the temperature to 99.1 degrees F. Decreasing to 0.9 changes the energy absorbed average to 486.7 with a maximum of 1946.9 and a temperature of 88.2 degrees F.

C.  Respectively, these changes would not be as dramatic as they would be closer to the equator and inland on the mid latitudes as the climate is typically more mild already. They would increase temperatures dramatically though raising them as much as 40 degrees with an increased greenhouse factor. Reducing the earth's albedo to that similar to Mercury's would be devastating. Reducing the amount of energy absorbed would dramatically affect the warmth of the planet. Being next to the ocean, Port Orford would experience less dramatic shift in temperatures than a location that is more inland, as it does now.