Climate Controls:
The map to the right shows the elevation of the Port Orford Region. The state lines are faint but noticeable. Port Orford is located at the first southern extruding tip along the coast below Washington State. Given the mountainous regions that exist below and and to the right of Port Orford, it is easy to suggest that some weather fronts exist here given the pattern of orographic lift- almost in the shape of a backwards L. Also noticeable is the ocean and Port Orford's proximity to it. Both a large body of water and mountainous regions provide a large potential for a variety of weather patterns and events to occur. One pattern that can exist is the ponding of fronts below the Cascade Region before they are pushed up and over the mountains. As mentioned before, the Chinook winds can travel above the Siskiyou Range and flow right into Port Orford subjecting the region to other patterns and events making Port Orford somewhat exclusive.
Below is a topographic map of Port Orford, a larger scale than above to indicate particular patterns and topology that exist at the micro scale. Notice the bathymetry right off the coast. Inside the port is significantly deeper than immediately to the west of Port Orford. Winds from the SE into Port Orford can bring some cooler temps while from the W will not be as cold given the depth of the Pacific. Something to note as well, the weather station used primarily for all the data in this section and previous sections is actually located to the W of town. The portion of water that is trapped between the coast and Port Orford may cause some micro climate variations in the part of town where the weather station is. The temperature and precipitation patterns (as indicated in the graph below) show a relatively stagnant pattern where coniferous forests thrive all year long.
The Graphical Data
The following graph shows some significant historical data from Port Orford. There is an obvious relationship between precipitation and temperature for this area.
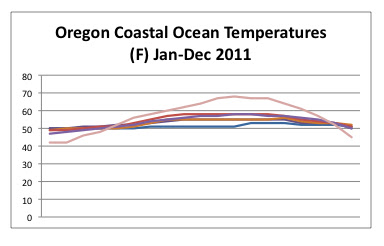
There is another relationship to be considered throughout the span of the year. Notice the regional coastal weather pattern temperatures parallel that of Port Orford temperatures. These temperatures were taken from the southern most point of the coast of Oregon to the Northern most point. Also notice the pink line that gets colder than all points also gets warmer than all the other points. What is interesting about this it is data received right off the coast of Port Orford. This suggests that the warming in the area (that is more or less unique in the region) is indicative of ocean temperatures. Quite interesting!
Click here to see an up to date description of wind speed and temperature for Southern Oregon and Northern California.
Climate Classification:
Comparing the Koppen Geiger classification of the Port Orford Region, the area along the coast of Oregon seems to be the same indicating some general weather patterns.
An interesting pattern of vegetation that exists at a micro scale of the region is the Port Orford Cedar. Aptly named for the proximity to Port Orford. The climate appears to parallel some of the topography and vegetation explained in the map below.
According to the Klamath-Siskiyou Wildlands Center: "The Klamath-Siskiyou region has acted as refugia during past climate events, which has contributed to the region’s exceptional geologic and biological diversity.The region is an ancient climate refuge where many species once widespread across the continent were forced to retreat during past climate shift events and now persist as ‘relic species,’ found here and nowhere else on earth. Species in this category include the endemic Siskiyou Mountains Salamander, Port-Orford Cedar and the Weeping Spruce."


No comments:
Post a Comment