Tuesday, April 17, 2012


The similarites between Medford, Oregon and Port Orford, Oregon are strinking. The relative temperature and precipitaion patterns parallel each other as one might assume being in the same regional area. Though the trends are roughly the same, there are some differences. Below are three charts of Port Orford and Medford showing the monthly Average Highs and Lows and monthly precipitation.

Average High

 Average Low

 Average Precipitation
(Charts Courtesy www.weather.com)


The Air Mass of the two locales is roughly the same. Pacific Maritime Polar winds attribute most of the weather of the area. The cold fronts that hit Port Orford also hit Medford in most cases. Below are two graphs comparing the avergae monthly wind speeds of each city to the national average.
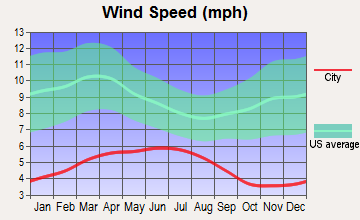
Medford
Port Orford

Both Cities have a relatively low average wind speed. For Port Orford this is surprising given the location on the coast. For Medford, this is also a surprise as it sits right in the Rogue River Valley. 
(Charts Courtesy of www.citydata.com)


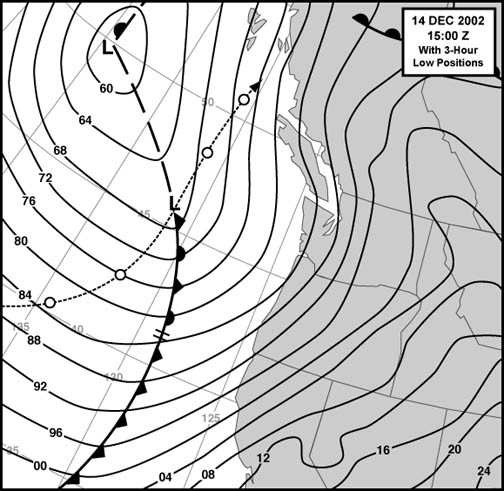
It is important to note the regional elevation patters when considering precipitation of these two locations. While Port Orford receives almost 5 times as much rain as Medford, they are both on the lee side of a mountain depending on the direction of the wind patterns. The "banana belt" of Port Orford that presumably causes unseasonably warm temperatures is from the Chinook winds that flow in from the south over the Siskiyou Mountain range in Northern Claifornia. While not the primary source of weather patterns, is significant to the area. The same weather pattern may also have an affect on Medford as well causing some very mild temperatures. Lows in Medford rarely reach below the 20's and highs rarely reach above 85 F. This parallel temperature pattern is unique considering how much further inland Medford is, especially considering it is extremely close to the lee side of the Cascade Mountain range.

(Map Courtesy of Me)


The geologic structure and the impacts of volcanic activity are also something to consider with these two locations. In the map below, there is an obvious string of volcanoes that stretch the western side of the continental US. You can go to the following for a very detailed account of the geologic/volcanic structure of Oregon in  the Oregon Geology PDF. This parallels nicely with what we were talking about in class today.


Though I could not find any specific information marking a relationship between the two locations, I have a hunch that there is some critical similarity between Port Orford and Medford concerning volcanoes. Medford is 77 miles away from Crater Lake National Park. Such a short distance from one of the areas largest volcanic eruptions had to have played some role that is significant to both locations. Even if it is just a sediment role from influencing the productive agricultural activity to sediment transport down the Rogue River (which hits the ocean just below Port Orford).

Too be continued...


And just a  great LiDar image of Port Orford.

Port Orford

Thursday, April 5, 2012

Blog Post #2

Air masses of Port Orford

Port Orford experiences mP fronts that have formed over high latitude oceanic regions. While in the winter, this area experiences cP air masses that while cool and moist are also unstable. The result is the formation of warm occlusions providing the orographic lift from the mountain range to the east providing the precipitation that is so typical of the area.


Impacts of the Jet Stream on Air Masses

A jet stream is an area of strong winds ranging from 40-140 MPH. These can be thousands of miles long extending across continents effectively impacting weather patterns. These jet streams are considerable means of transport for the weather patterns experienced in any location. 


Precipitation and Air Masses

As a rule, air masses are not associated with precipitation. However, with the orographic lifting of the area, the relationship is apparent. The image below shows the annual precipitation of the area. The county at large receives moderate to above normal precipitation. What is interesting to note are the areas closest to the coast that receive the least amount of rain. With an increase in elevation, there is an increase in precipitation.


Occluded Fronts of Port Orford

This location experiences cold occluded fronts on a regular basis. Below is an example of a cold front in with a cold type occlusion reaching the western coast of the US in December 2002. This is an example of strong storm development that can occur in these conditions.


The 3 satellite images below show today's imaging from the National Weather Service

This water vapor image shows short wave troughs and jet streams as well as upward vertical motion.
Satelite Image

Visible light 
Satelite Image

Infrared
Satelite Image


How Fronts are affecting the biology of the region

Link to PDF about fronts and plankton around Port Orford OR

Abstract:
Foam lines oriented parallel to shore are common features of rocky shores. At times, the water coloration is different on either side of the foam lines, suggesting they are associated with fronts. We investigated the effect of shore-parallel foam lines and associated fronts on distributions of holo- and meroplankton. We performed CTD transects to describe the fronts and carried out vertical zooplankton tows to describe the distribution of zooplankton relative to the fronts. Fronts were within tens of meters of shore and were apparently generated by the interaction of coastal currents with local topography. We sampled four sites (three coves and one open coastal site), some of which were separated by only a few hundred meters. At each site we found shore-parallel foam lines and associated thermal fronts, but the characteristics of the fronts were different at three sites, suggesting that three different mechanisms were generating the fronts. At two coves, the foam line and front appeared to be due to the interaction of wind-driven currents from the north with coastal topography. At the third cove, the front appeared to be due to the expansion of solar-heated surface waters out of the cove. The foam line and front at the open coastal site appeared to be due to boundary mixing. At the coves, the distributions of holoplankters, meroplankters and phytoplankton were clearly altered by the presence of the fronts. At the open coastal site, the front had less effect on the distribution of zooplankton. The coastal ocean is the source of new recruits to the intertidal zone and an important source of food in the form of phytoplankton for filter feeders. We hypothesize that these very nearshore fronts may play an important role in structuring intertidal communities with which they are associated.


Misc Links

This link shows a current animation of the Western US satellite image-visible

This link shows a current animation of the Western US satellite image-infrared

Shows US map of wind direction and wind speed